Microsoft’s Power BI is a game-changer for data visibility and improved decision-making and so it is no surprise that so many organisations have deployed it or intend to do so.
You may well be amongst those that use it on a daily basis or have started to explore it. In this article, we will talk about 10 key features of Power BI you may not be aware of.
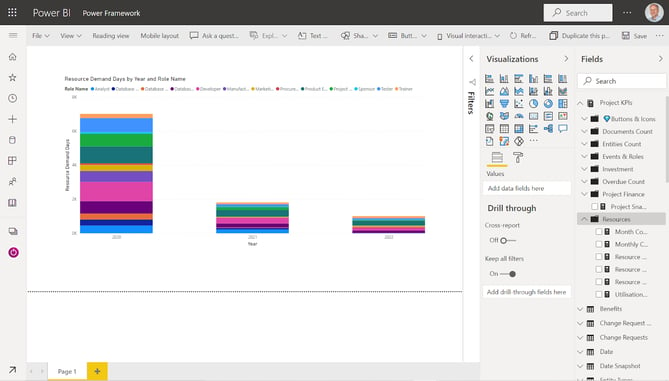
1. Enable Report Authoring For Everyone
Power BI offers huge functionality and certainly requires deep BI expertise when it comes to building complex data models, combining multiple data sources or performance-tuning large datasets.
Expert BI developers create these datasets using Power BI desktop – but once this is published to the Power BI service, the hard work is done. The published dataset now empowers business users to create ad-hoc reports in the browser, hiding all that complexity and making reporting authoring simple.
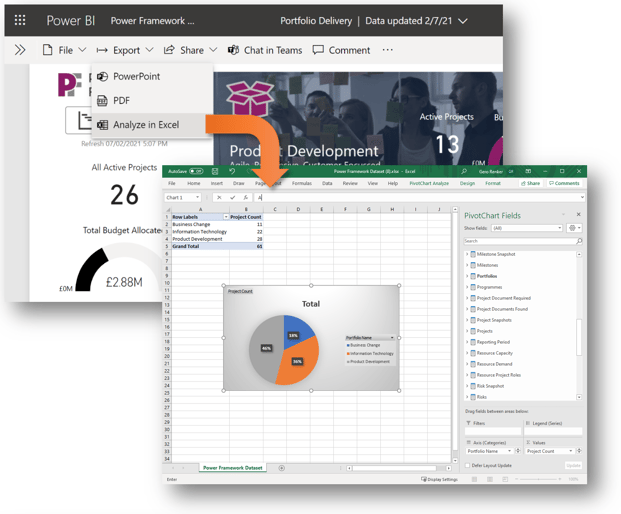
2. Take Your Data Into Excel
It is easy to bring Power BI datasets into Excel, and then view and interact with them using PivotTables, charts, slicers, and other Excel features. This is a great way to empower data analysts who are most comfortable with Excel and ensures they won’t work with data that is out of date or different to the ‘official’ Power BI dataset. Excel workbooks consuming this data can be created once and then stay connected to refresh data as required.
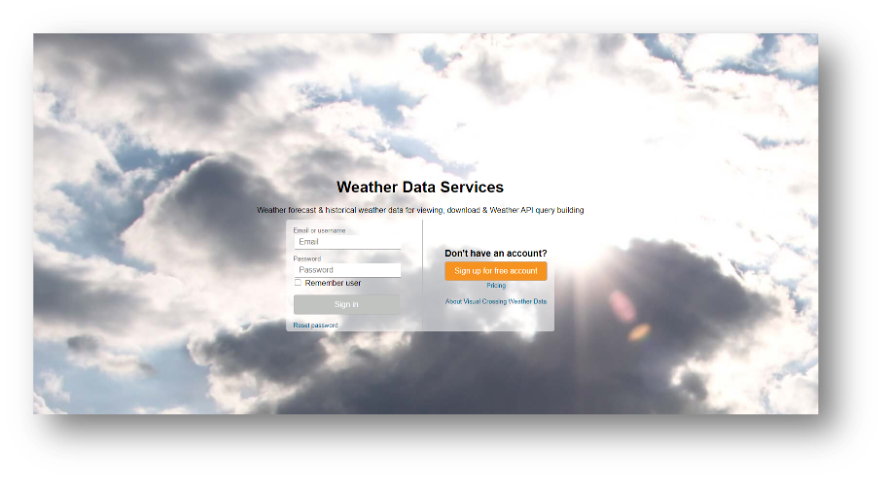
3. Harvest Data from Web Pages and Public Data Sources
Power BI makes it possible to connect to a vast array of open data sources published by both public and private sector organisations, institutions and web sites. This could be data relating to Economy, Finance, Crime, Transportation, Education, Housing, Health, Sports, and many other subjects.
How about analysing your profitability against weather trends, for instance? This is an example of a website that can provide the data: https://www.visualcrossing.com/
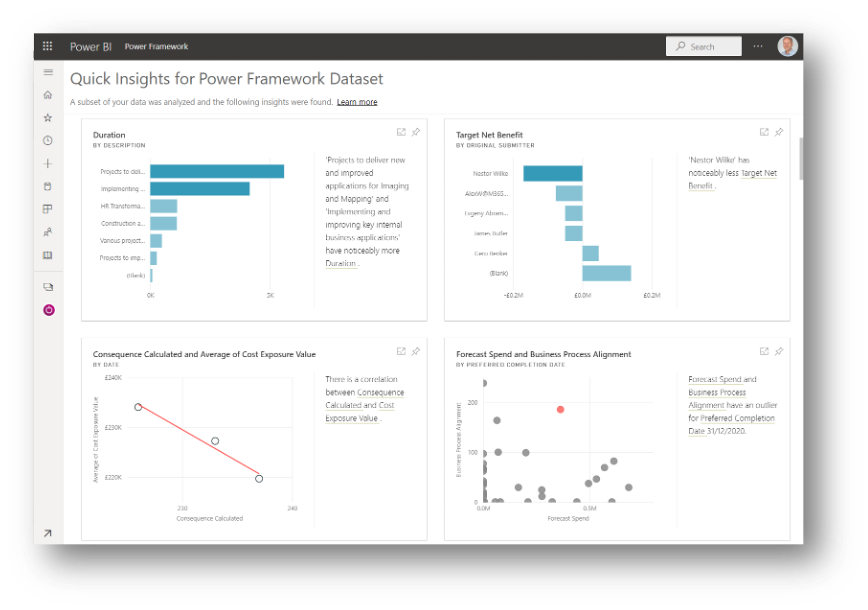
4. Insights Discovery
If you’re not sure where to start with the analysis of your data, you can ask Power BI to find interesting trends and patterns. These are presented in the form of visuals that are called Insights. Power BI quickly searches different subsets of your dataset, applying a set of sophisticated algorithms to discover those potentially interesting insights.
The kind of patterns it can detect include outliers (categories with values significantly different to others), changes in trends over time, seasonality (i.e., periodic patterns), or correlation between different measures. The results may not always be relevant, but you may well stumble upon nuggets of insight gold.
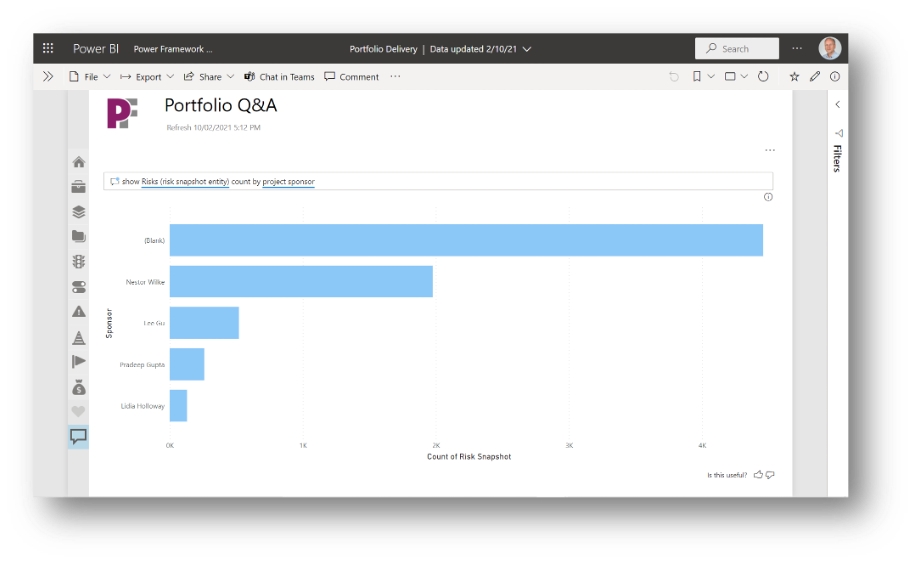
5. Natural Language Q&A
Power BI’s Q&A feature uses the latest artificial intelligence and natural language processing technologies, so you can ask a question in the way you’d say it naturally. The Q&A feature searches your data in an instant to bring you speedy and accurate answers.

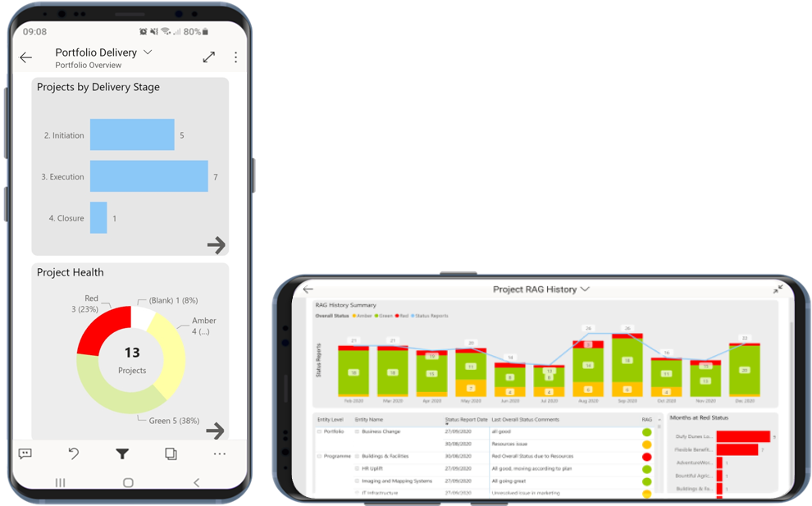
6. Power BI Mobile
No need to worry about ever being without access to your dashboards – just take them with you with Power BI mobile. Download the app to your mobile device, be it phone, tablet, or even Apple Watch, and view and interact with your data on the go. Report developers can build mobile-optimized reports, using a phone emulator canvas to create mobile versions of regular reports.
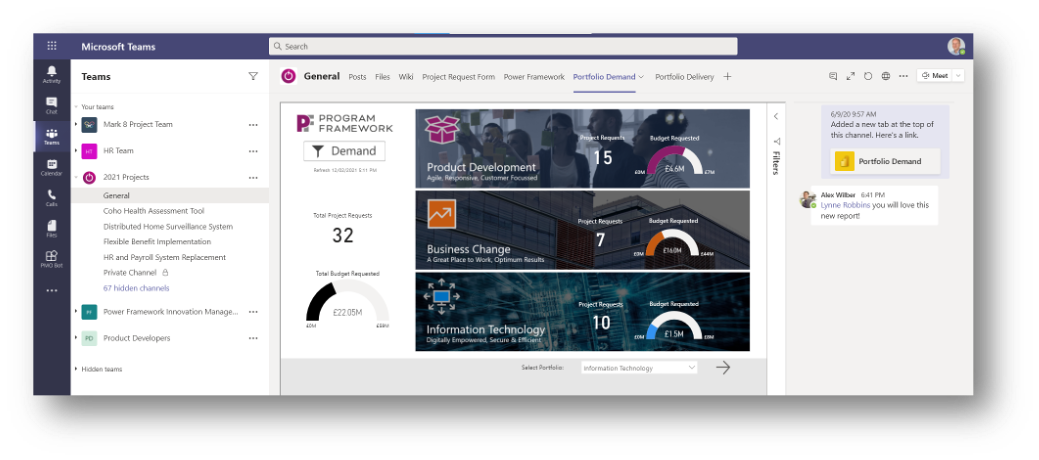
7. Integration with Microsoft Teams
A great way of sharing your reports is by way of embedding this in tabs within Teams channels. Keep in mind though that users still need to be licensed for Power BI and must have authorised access to the report.
You can engage in a Teams chat relating to the report via the chat side panel.
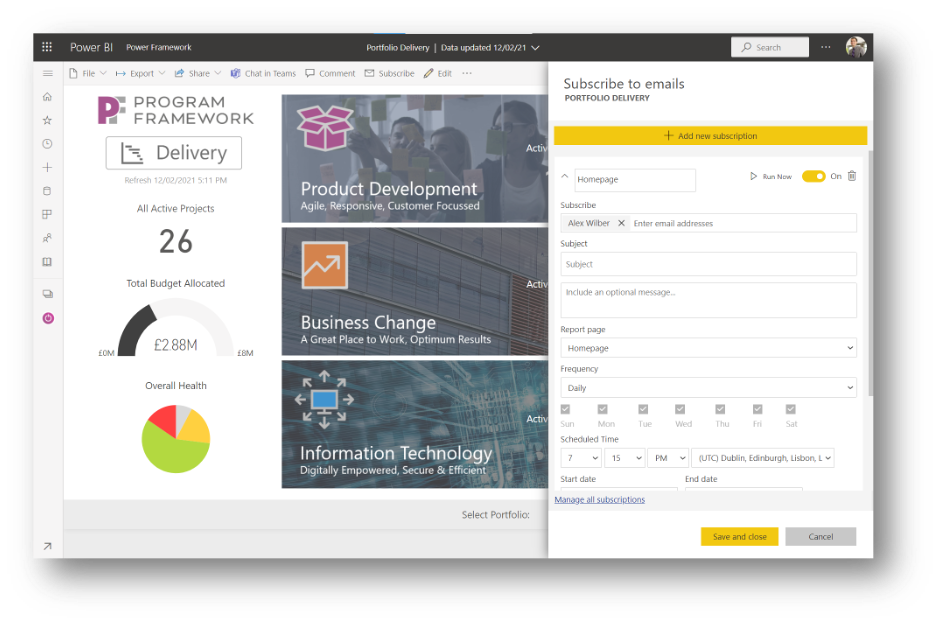
8. Subscriptions
With Power BI’s subscriptions it is easy for you to keep up-to-date with the latest report updates. Subscriptions allow you to have a mail sent with an image of the report and link to the report in the service - you choose the frequency of the email.
On mobile devices with Power BI apps installed, selecting this link launches the Power BI app, instead of opening the report or dashboard in the Power BI web site.
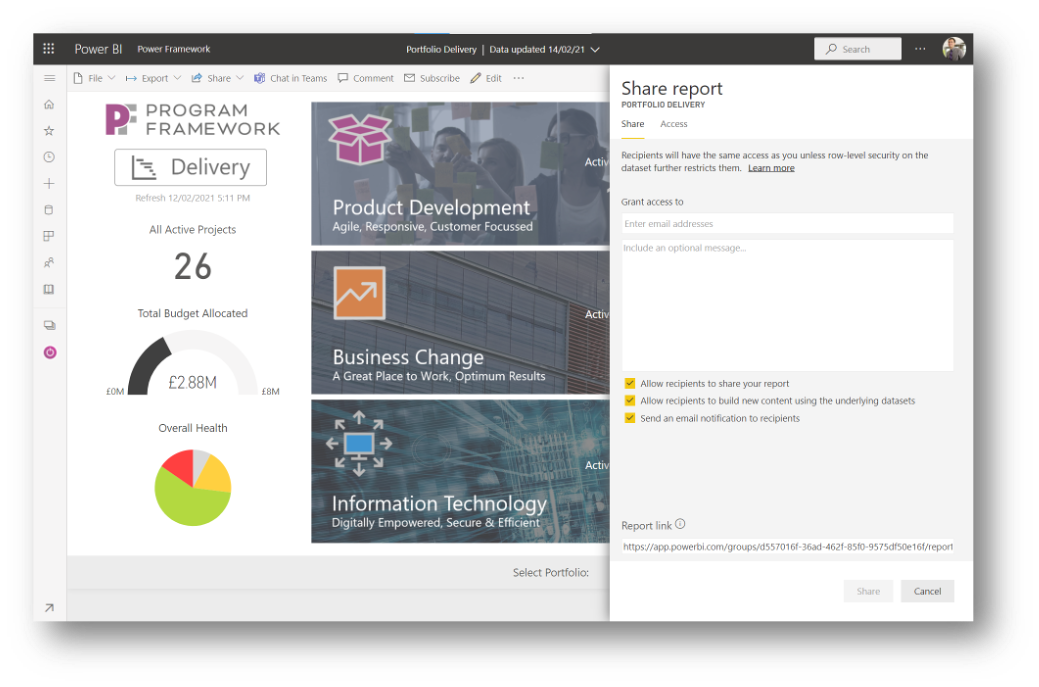
9. External Parties Sharing
It is easy to share reports with people outside your organisation – just grant access to their external email addresses. You can trigger an email to send them the link to the report, and also control if they should be allowed to share it with others or if this link is personal to them. Do note though that the recipient must be licensed for Power BI in their own Microsoft tenant.
10. Comments
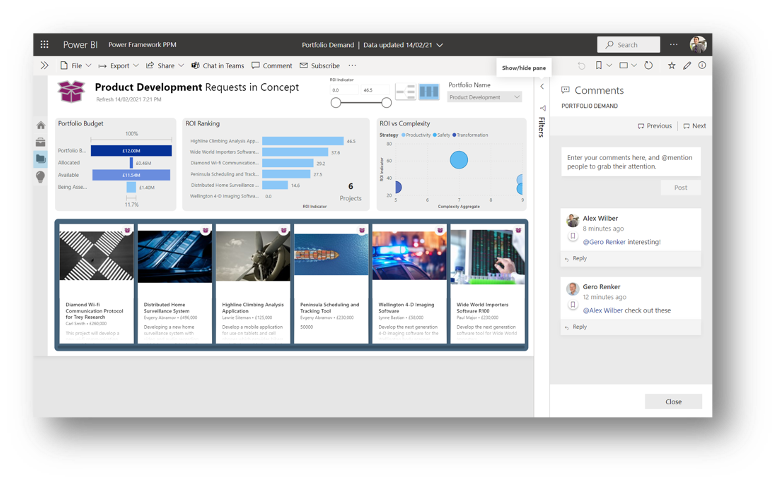
You can add comments to a report or dashboard, or specific visuals. When you add a comment, Power BI captures the current filter and slicer values and creates a bookmark.
This means that when you select or respond to a comment, the report page or report visual may change to show you the filter and slicer selections that were active when the comment was first added.
This is a great way of sharing an interesting insight – the comment refers to a particular view of the report which is preserved through the bookmark.
Power BI: Beyond the Basics
Power BI is packed with powerful features that go beyond basic reporting, enabling businesses to maximize data-driven decision-making. From seamless report authoring and Excel integration to AI-driven insights and mobile accessibility, these capabilities enhance efficiency and collaboration.
Whether you're a seasoned BI professional or just getting started, exploring these lesser-known features can help you unlock even more value from your data. With continuous advancements from Microsoft, Power BI remains a game-changer in the analytics space, making data more accessible, actionable, and impactful for organizations of all sizes.
Join the conversation with our PPM software experts on LinkedIn.